


Introduction to Windows Performance Monitor
Windows Performance Monitor is a powerful yet often overlooked tool that comes bundled with your Windows operating system. Its primary purpose is to help you monitor your system’s performance and identify potential bottlenecks or issues. In this guide, we will introduce you to this valuable tool, making it easy for even new users to leverage its capabilities effectively.
Performance Monitor: Real-Time Statistics
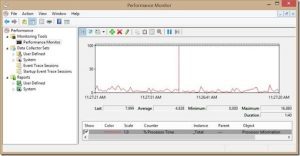
When you first open Performance Monitor
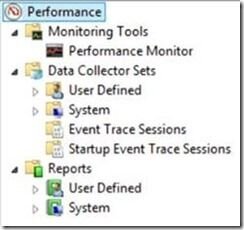
you’ll be greeted with a summary of your system’s vital statistics, including memory usage, network activity, and disk utilization. Right-clicking on “Performance” even allows you to view performance statistics of other computers remotely (note: some requirements are needed for remote connection).
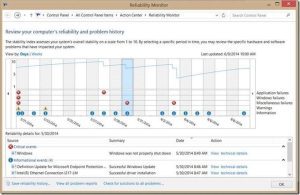
Additionally, from the “Monitoring Tools” icon, you can access the Resource Monitor and System Reliability Monitor, providing deeper insights into how your system resources are being utilized and tracking critical events.
Data Collector Sets: Capturing Performance Metrics
While Performance Monitor is great for viewing real-time statistics, its true power lies in capturing performance data over a specified period. This allows you to identify trends and analyze your system’s overall performance. To achieve this, you can create “Data Collector Sets” that collect and record data over time.
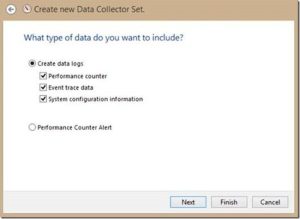
Three types of Data Collector Sets:
- Performance Counter: Captures data based on the polling of an event at a specified time interval.
- Event Traces: Captures data based on specific events that occur rather than at fixed intervals.
- System Configuration Information: Captures configuration information for analysis.
Creating a Custom Data Collector Set:
- Name your Data Collector Set and choose the “Create manually (Advanced)” option.
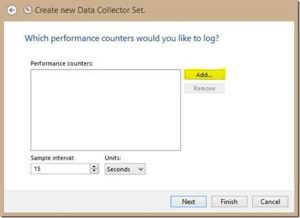
- Select “Create Data Logs” and specify the desired counters for monitoring, such as CPU usage or disk read/write activity.
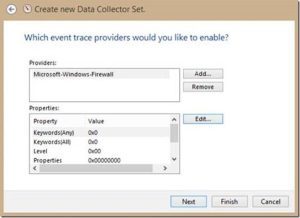
- Add trace providers to collect specific event information, like software updates or firewall events.
- Set the counter interval rate (how often to capture data) and configure options based on your needs.
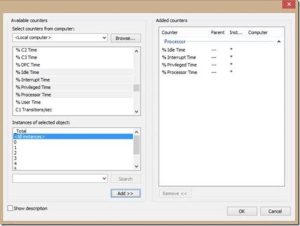
- Once you click Add, you can select counters and then add them to the “Added Counters” box. Note that you have options in terms of whether you want Perfmon to collect the data as a total or if you want to break the data up, in this case, per processor. You should pay attention to which one you select as the meaning of these counters depends on what is being counted.
- You will then be prompted to add trace providers. Trace providers simply provide information to perfmon about a specific set of events. For example, if you wanted to collect event information about the Windows Firewall, you would select the “Microsoft-Windows-Firewall” provider. You can then edit the properties (if you know what you are doing) and even record registry keys (after you hit next you can specify which keys to record).
- You can also specify a location where you would like to save the data. By default, the data is saved to: %systemdrive%\PerfLogs\Admin\New Data Collector Set.
- Finally, you can select a user that you would like to run the data collector set as. This may be helpful in environments where desktops and servers are locked down for security purposes.
Reports: Viewing Collected Information
If you look at the “New Data Collector Set” that we just created, you can see that it contains a performance counter, a trace, and a configuration collector. You can right click on any of these to modify them as you see fit.
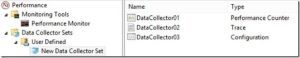
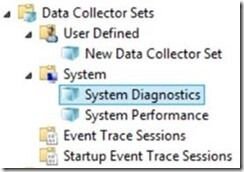
Finally, if you look at the remaining items under Data Collector Sets, you can see a bunch of preconfigured collector sets.
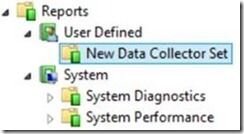
Reports
The final part of Performance Monitor is the Reports section. Here you can view the information that was collected by your data collector sets. If you have never run your data collector set, then you will not see any information when you click on it.
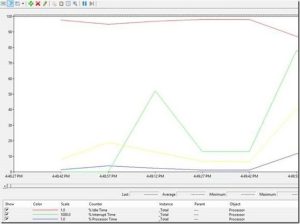
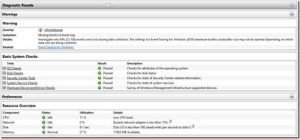
However, once you have run your data collector set, you can click on it and see the reports and information collected:
So this is a basic overview of Windows Performance Monitor. Once you are familiar with the parts, you can then dive into learning about which counters to use when, and what your counter interval rate should be when you are trying to capture this kind of data vs that kind of data.
Conclusion
Windows Performance Monitor is a valuable tool that can greatly enhance your understanding of your computer’s performance. By mastering the art of capturing performance metrics and analyzing trends, you can make informed decisions to optimize your system’s efficiency. So, don’t hesitate to explore and experiment with this powerful tool, and watch your PC’s performance soar to new heights!